I'm a data professional who spent the last five years turning messy product and marketing data into models and dashboards teams actually use. I care most about the write-up: why an approach was chosen, what it trades off, and what breaks first at scale.
- Data Science
- Machine Learning
- Business Analytics
- Statistics
- Python
- SQL
- R
- JavaScript
- pandas
- scikit-learn
- XGBoost
- TensorFlow
- A/B testing
- PostgreSQL
- Snowflake
- BigQuery
- MongoDB
- Tableau
- Power BI
- Looker
- D3.js
- Plotly
Case studies
Five projects across marketing, advertising, media and e-commerce. Each card opens into a full write-up covering approach, trade-offs, and what changes at scale.
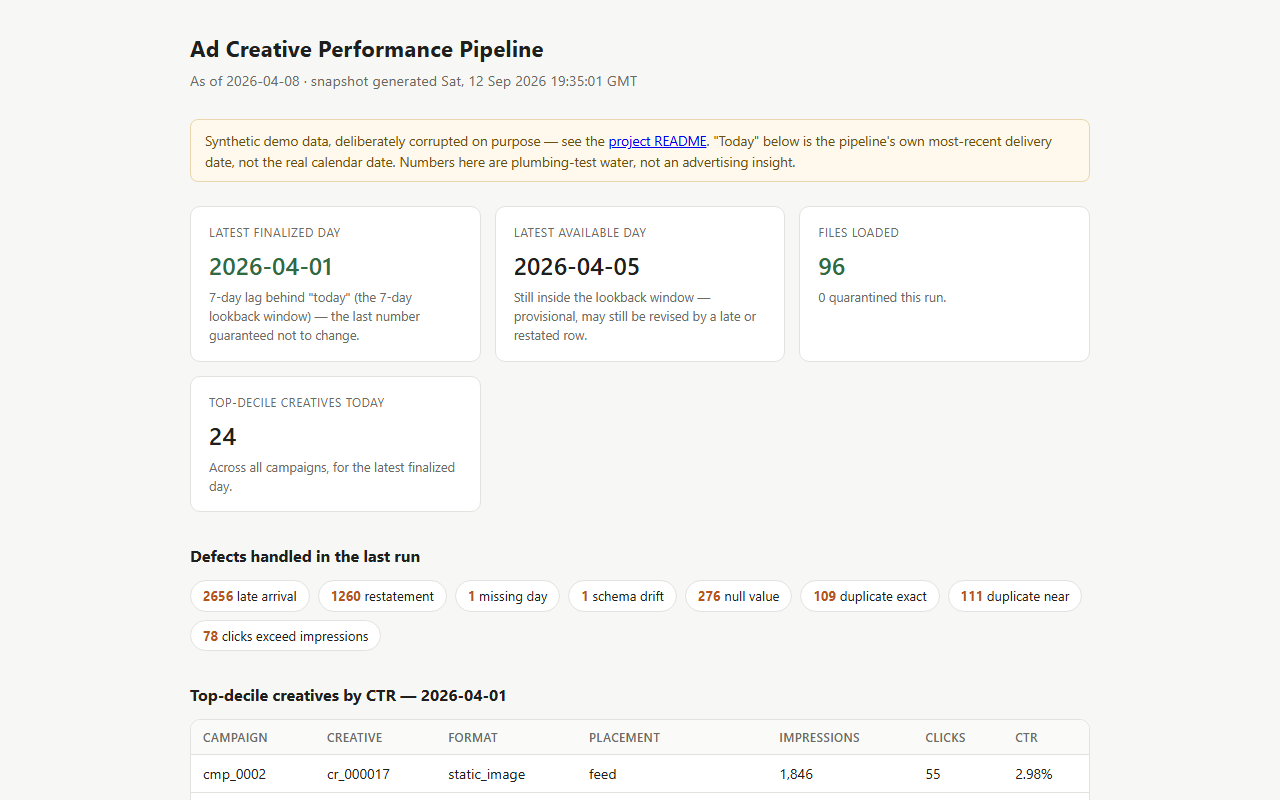
Ad Creative Performance Pipeline
2026A dbt-core + DuckDB pipeline that ingests openly synthetic, deliberately corrupted ad-creative performance data and proves it can still deliver reliable same-day numbers — the deliverable is the pipeline, not an advertising finding.
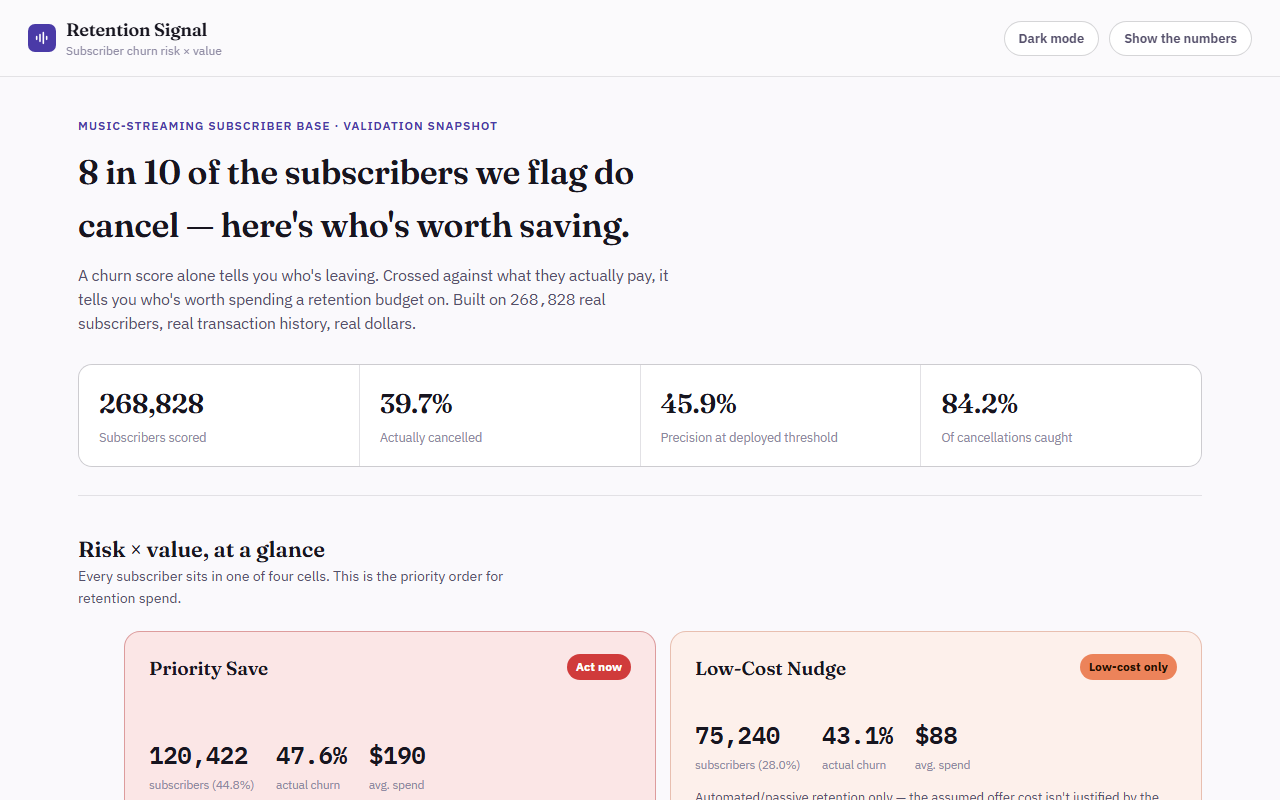
Subscriber Churn Early-Warning & LTV Segmentation
2026Score 21.5M real music-streaming transactions for churn risk and cross it with real subscription spend, so retention budget goes to subscribers worth saving.
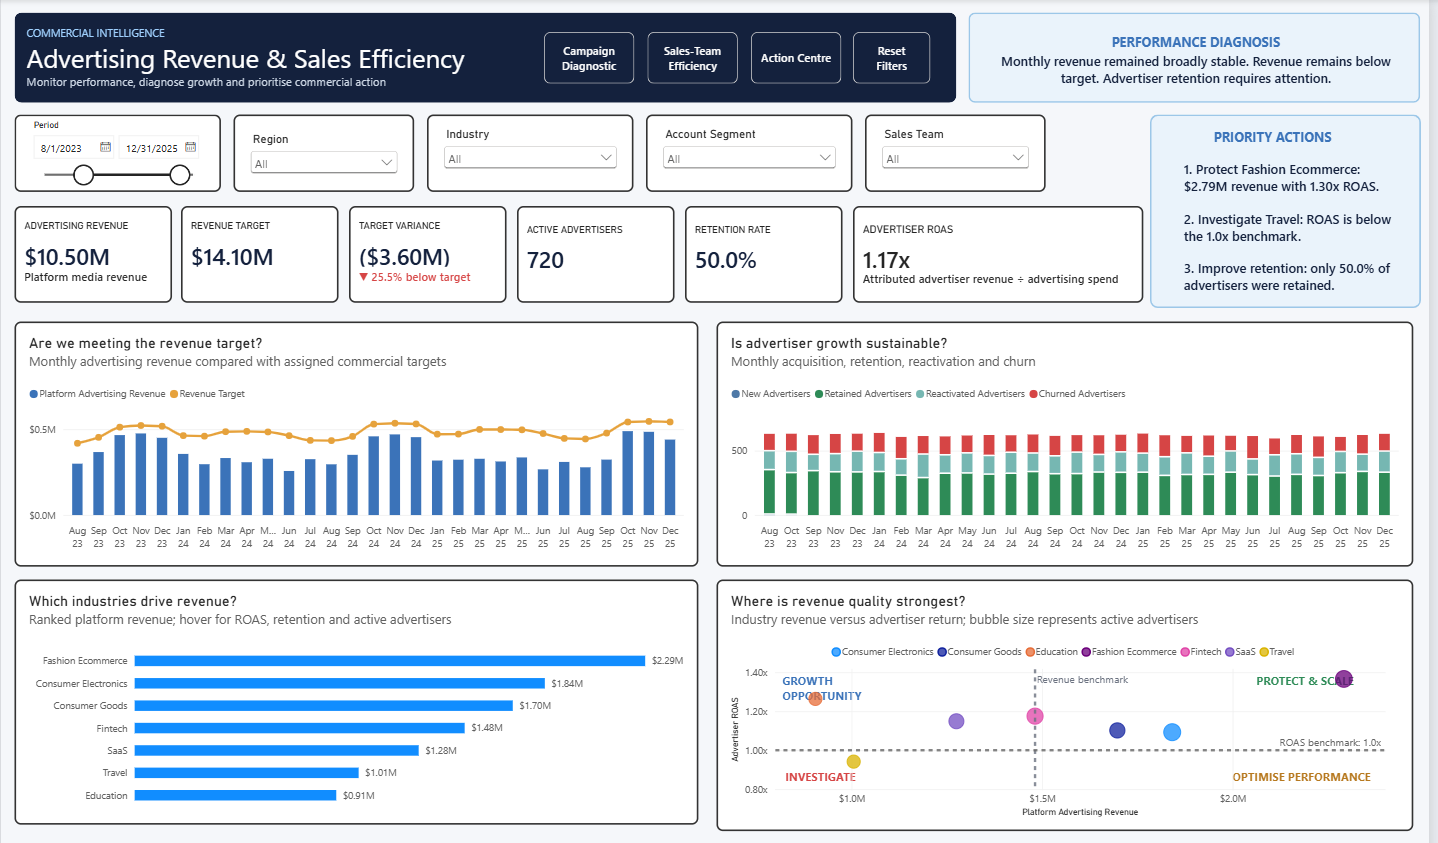
Advertising Revenue & Sales Efficiency Growth Diagnostic
2026An end-to-end commercial analytics system that explains why advertising revenue is below target and converts campaign, lifecycle and sales evidence into transparent account actions.

E-Commerce Purchase-Prediction & Conversion Funnel Analysis
2019A full-funnel behavioural diagnosis showing that once an item is carted it's bought 82.67% of the time — so the real leak, and the real opportunity, is at view → cart.
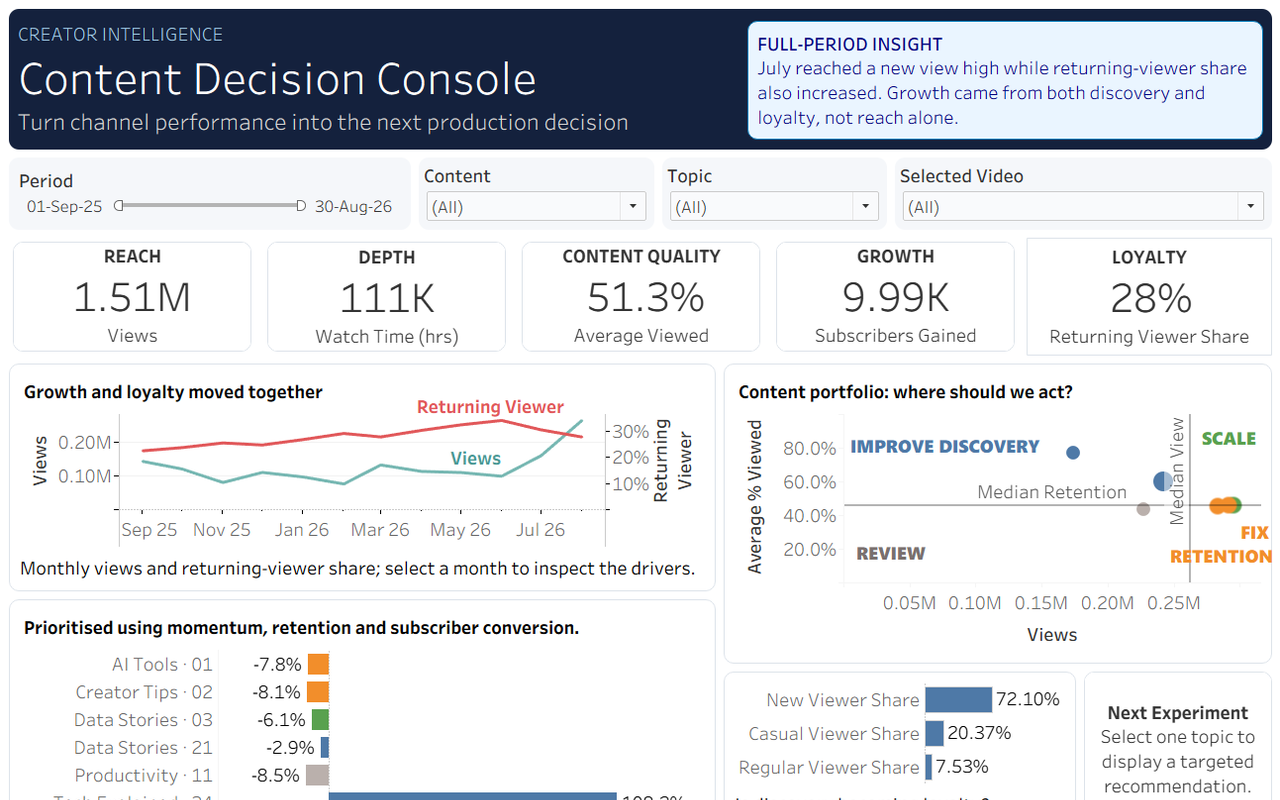
Creator Content Decision Dashboard
2026Which content should a creator scale, promote or improve next?
Let's talk data
Based in Brisbane — open to opportunities across Australia and Hong Kong, including remote work.